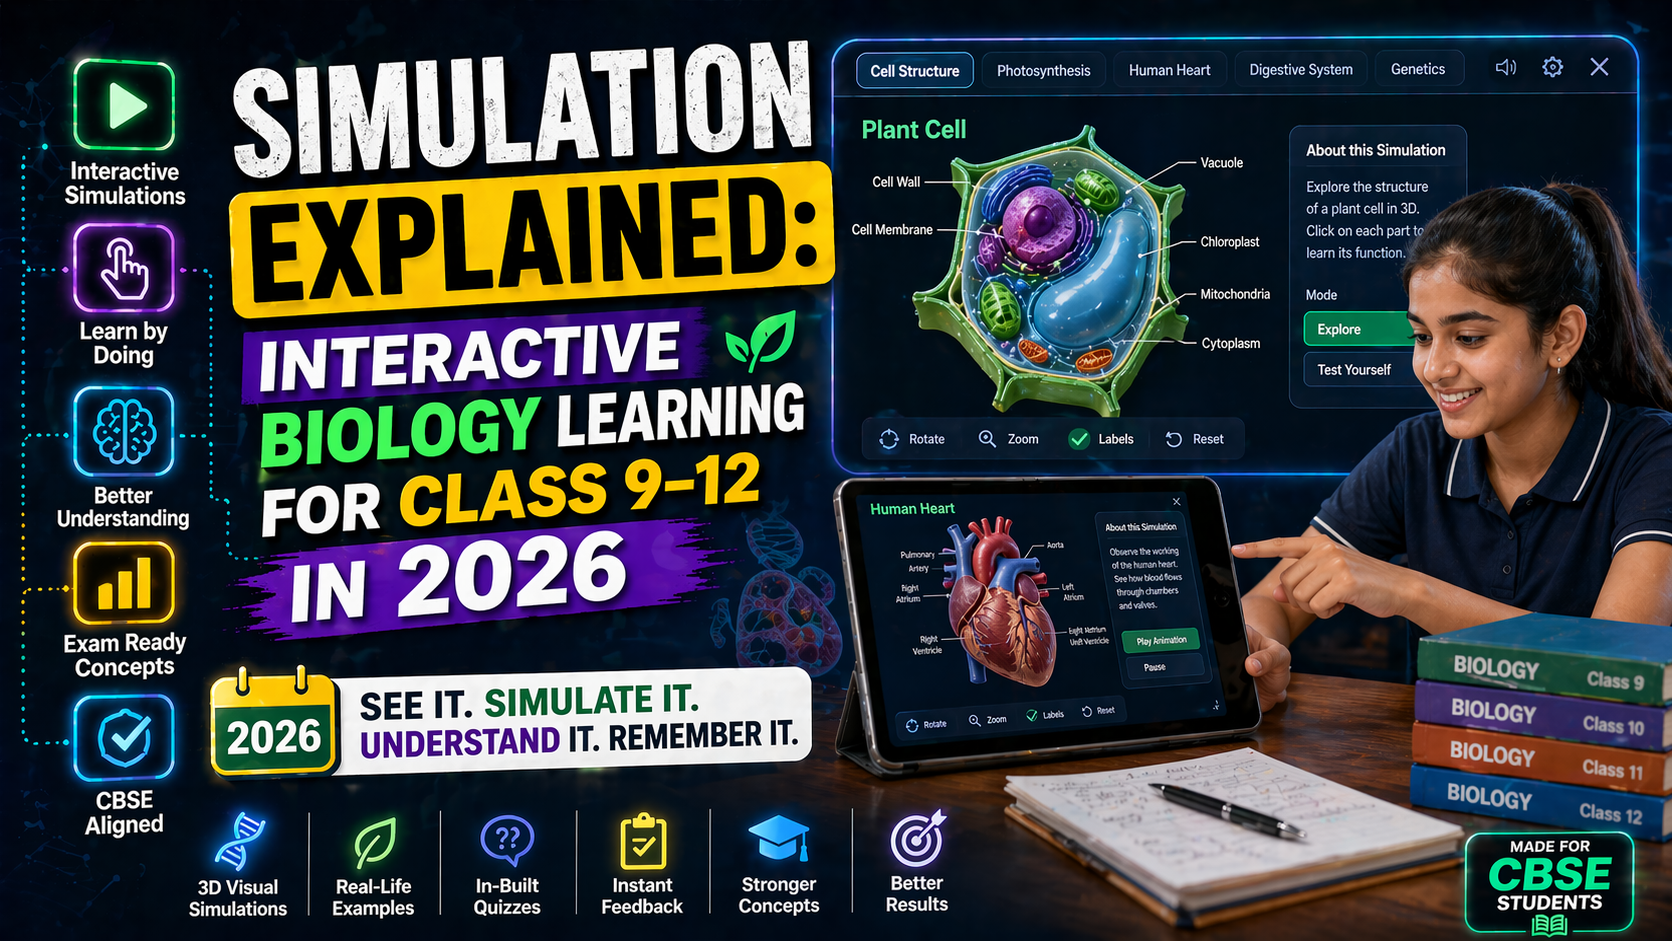
Struggling to visualize the heart diagram in your Class 11 NCERT Biology textbook? You’re not alone—static diagrams can feel confusing, especially when you’re trying to grasp how blood flows through chambers, valves, and vessels. What if you could see the heart beat in real time, rotate it 360 degrees, and even tweak variables like heart rate or blood pressure to watch the effects? With SPYRAL’s AI-powered interactive simulations, you can do exactly that—making the heart diagram click in ways textbooks never could.
This guide will help you master the heart diagram for your CBSE exams in 2026, using interactive 3D simulations that align with the NCERT syllabus. Whether you're preparing for board exams, NEET, or just want to understand human anatomy better, we’ve got you covered.
Why This Matters: The Heart Diagram Isn’t Just a Drawing—It’s Your Key to Biology Mastery
In India’s competitive education landscape, Class 11 biology isn’t just about memorizing terms—it’s about understanding how systems work together. The heart diagram is foundational: it appears in NCERT textbooks, CBSE practical exams, and even NEET preparations. But static images often leave gaps. Imagine:
- Students in Sacred Heart CBSE School Villupuram (or any CBSE school) struggling to visualize the pulmonary vs. systemic circulation paths.
- NEET aspirants who need to recall the heart’s role in electrical conduction during high-pressure exams.
- Class 11 students who want to experiment—not just read—about how heart rate affects blood pressure.
With NEP 2020’s focus on experiential learning, interactive simulations aren’t just helpful—they’re essential. They turn abstract diagrams into dynamic, hands-on experiences that stick in your memory long after the exam.
Step 1: Decode the Heart Diagram with AI-Powered Labels
The NCERT heart diagram is packed with terms like atria, ventricles, aorta, pulmonary trunk, SA node, AV node, and more. But what if you could:
- Hover over each part to see its function in real time?
- Watch blood flow direction with color-coded arrows?
- See the heart’s electrical signals (like the P-QRS-T wave) as they trigger contractions?
Our interactive heart diagram does all this—and more. It’s not just a static image; it’s a living model that helps you:
- Understand why the left ventricle has thicker walls than the right.
- Visualize how valves prevent backflow during systole and diastole.
- Explore the role of coronary arteries in supplying oxygen to the heart muscle itself.
Key Terms from the NCERT Heart Diagram
Here’s a quick cheat sheet to align with your textbook:
| Part | Function |
|---|---|
| Right Atrium | Receives deoxygenated blood from the body via the superior vena cava and inferior vena cava. |
| Right Ventricle | Pumps blood to the lungs via the pulmonary trunk. |
| Left Atrium | Receives oxygenated blood from the lungs via the pulmonary veins. |
| Left Ventricle | Pumps oxygenated blood to the body via the aorta—the thickest muscular chamber! |
| SA Node | The heart’s natural pacemaker, generating electrical impulses. |
| AV Node | Delays impulses to coordinate atrial and ventricular contractions. |
Why Static Diagrams Fail (And How Simulations Win)
Research shows that interactive visualizations improve retention by up to 80% compared to passive learning. Here’s why:
- Engagement: You’re not just reading—you’re exploring.
- Retention: Seeing blood flow in action helps you remember pathways.
- Application: You can test hypotheses—like what happens if the AV node fails?
Step 2: See the Heart in Action with 3D Simulations
Forget heart free png downloads—our simulations let you:
- Zoom in on the mitral valve to see how it prevents regurgitation.
- Adjust heart rate and watch how it affects stroke volume.
- Compare healthy vs. diseased hearts (e.g., stenosis or arrhythmia).
Try This Simulation Free
Open the interactive simulation on anAIza School — no download, no signup needed.
Open Simulation →Rotate the heart, adjust heart rate, and watch blood flow in real time. See how changes affect circulation!