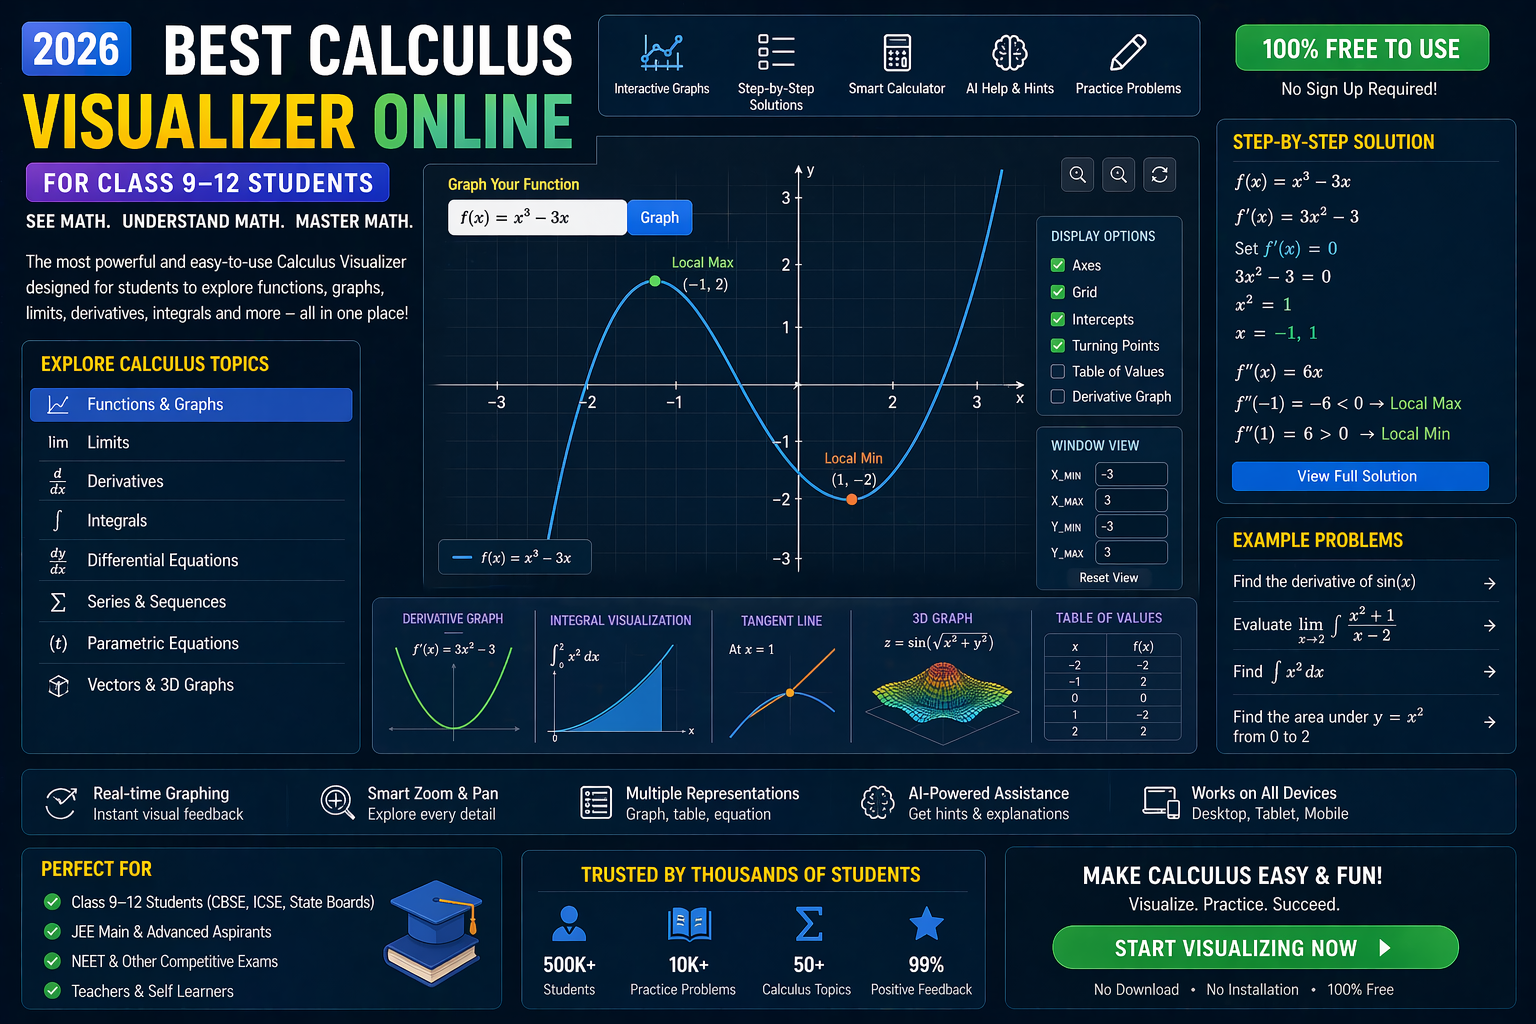
If you're a CBSE Class 11 or 12 student staring at an integration problem thinking, ‘What even is this?’, you’re not alone. Integration can feel abstract — until you see it move. That’s why integration FreePik isn’t just another formula sheet — it’s a living, breathing math lab where you drag, drop, and watch functions integrate in real time. Whether you're preparing for board exams, JEE, or NEET, visualizing integration transforms confusion into confidence. And the best part? You can do it for free, right now, without signing up.
In this guide, we’ll show you how to use interactive math visualizations to solve integration problems step by step — the way your brain actually learns. You’ll see how a coordinate geometry tool and a trigonometry visualizer can turn a dry formula into a dynamic experience. By the end, you’ll not only solve problems faster — you’ll understand them.
Why This Matters: Integration in Real Classrooms (2026)
In 2026, the CBSE curriculum continues to emphasize competency-based learning, especially in mathematics. The NEP 2020 framework pushes schools to move beyond rote memorization — students must apply, visualize, and experiment. Yet, many students still rely on static textbooks and YouTube videos that show perfect solutions, not the messy process of learning.
That’s where integration FreePik changes the game. Instead of copying steps from a teacher’s board, you build the solution yourself. You change the limits, tweak the function, and watch the area under the curve form in real time. This isn’t just helpful — it’s how top performers in JEE and NEET actually train. And with AI-powered explanations built into every simulation, you get instant clarity when you’re stuck.
Imagine preparing for your Class 12 board exam and being able to see why the integral of x² is x³/3 — not just memorize it. That’s the power of interactive math visualization.
How to Use a Coordinate Geometry Tool to Visualize Integration
A coordinate geometry tool isn’t just for plotting points — it’s your gateway to seeing integration as area. Here’s how to use it effectively:
1. Plot the Function
Start by entering a simple function like f(x) = x² on the coordinate plotter. Watch the parabola appear on the grid. Now, use the integration slider to set your lower and upper limits — say, from x = 0 to x = 2. Instantly, the area under the curve lights up in blue. That shaded region? That’s the definite integral.
2. Break It Down with Riemann Sums
Feeling curious about how integration actually works? Toggle on the Riemann sum view. You’ll see rectangles stacking up under the curve — more rectangles mean a more accurate approximation. Drag the slider to increase the number of rectangles. Watch as the sum approaches the exact area. This isn’t just theory — it’s math in motion.
3. Connect to Real-World Meaning
Integration isn’t just about numbers. It’s about accumulation. Use the tool to model real scenarios: distance traveled over time, total rainfall from a rate, or even the volume of a rotating shape. Seeing the connection between math and life makes it stick.
🔗 Explore the coordinate plotter on SPYRAL AI Workbench — no login required.
Master Integration with a Trigonometry Visualizer
Trigonometric integrals often trip up even strong students. But with a trigonometry visualizer, you can see why ∫ sin(x) dx = -cos(x) + C — not just memorize it. Here’s how:
1. Visualize the Wave
Enter f(x) = sin(x) into the visualizer. Watch the smooth sine wave roll across the screen. Now, integrate it from 0 to π. The area under one hump appears — and the integral value updates in real time. You’ll see that the total area is 2, matching the known result.
2. Explore Phase Shifts and Amplitudes
Change the function to f(x) = 3 sin(2x + π/4). Adjust the amplitude, frequency, and phase shift. Each change updates the integral value. You’re not just solving — you’re experimenting with calculus.
3. Solve Definite Integrals with Ease
Use the tool to solve problems like ∫₀^(π/2) cos²(x) dx. The visualizer breaks it into parts using identities. You’ll see how cos²(x) = (1 + cos(2x))/2 simplifies the integral — and the area under the curve confirms it.
📚 Trigonometric integrals can be tricky — but visualizing them makes them intuitive.
Solve Any CBSE Integration Problem with an Equation Solver CBSE Style
You’ve seen how visualization helps. Now, combine it with smart solving. An equation solver CBSE-style tool doesn’t just give answers — it guides you through the process, step by step, with AI explanations.
1. Type Your Integral
Enter an integral like ∫ (3x² + 2x + 1) dx. The solver breaks it into parts: ∫3x² dx + ∫2x dx + ∫1 dx. It shows each step — power rule, constant rule — with visual cues.
2. Get AI-Powered Hints
Stuck on ∫ e^(2x) dx? The AI explains: “Use substitution. Let u = 2x, then du = 2 dx.” The visualizer even draws the substitution on a graph, showing how the area transforms.
3. Check Your Work Instantly
After solving, input your answer. The tool highlights mistakes in red and explains why. No more guessing — just learning.
🔍 NCERT integration problems are the gold standard for CBSE exams. Use the solver to practice them interactively.
Go Beyond Basics: Experiment with a Matrix Operations Lab
Wait — matrix operations in integration? Yes! Integration often leads to systems of equations. Use a matrix operations lab to solve integrals that result in linear systems — like partial fractions or Laplace transforms.
1. Solve Partial Fractions Visually
Enter ∫ (x + 3) / (x² - x - 6) dx. The lab breaks it into partial fractions: (A/(x-3)) + (B/(x+2)). It solves for A and B using matrix inversion — and shows the result as a sum of logs. You see the algebra and the geometry together.
2. Visualize Linear Systems from Integrals
Some integrals lead to systems like:
2a + b = 5
a - 3b = -1
Enter the matrix into the lab. Watch the solution appear as a point where the two lines intersect. This connects integration to linear algebra — a powerful combo for JEE aspirants.
🧮 Explore matrix tools for integration on SPYRAL’s NEP 2020 platform.
What If You Changed This? 3 Real Experiments to Try
Don’t just watch — play. Try these scenarios in the integration visualizer and watch math come alive:
1. What if the limits swap?
Integrate ∫₁² x² dx — then swap the limits to ∫₂¹ x² dx. What happens to the area? What happens to the value? The visualizer shows the area flips — and the integral becomes negative. This isn’t just a rule — it’s a visual fact.
2. What if the function flips sign?
Try ∫₀^π sin(x) dx. Now try ∫₀^π -sin(x) dx. The area under the curve changes from positive to negative. This is why total area isn’t always the same as the integral value — a key concept in physics and engineering.
3. What if you add a constant?
Integrate ∫ (x² + 5) dx. Then try ∫ (x² + 10) dx. The visualizer shows the area grows — but the shape stays the same. This helps you see why constants don’t affect the derivative but do affect the integral.
Each of these experiments builds intuition. And intuition is what turns a struggling student into a confident problem-solver.
Try It Free on SPYRAL
Everything discussed in this article is available for free on SPYRAL AI Workbench — Maths Visualizations. No signup required for guest access — just open it and start learning.
Explore SPYRAL AI Workbench — Maths Visualizations →Frequently Asked Questions
What is integration FreePik and how is it different from a PDF?
Integration FreePik refers to interactive, visual tools that let you explore integration in real time — not static images or PDFs. Unlike a formula sheet, these tools let you change variables, see areas form, and get AI explanations. They’re designed for active learning, not passive reading. Think of it as a living textbook.
Can I use a coordinate geometry tool to solve integration problems for JEE Main?
Absolutely! In fact, many JEE toppers use coordinate-based visualizers to understand the geometric meaning of integrals — especially for areas between curves. It helps avoid calculation errors and builds deep understanding. The tool can handle polynomials, trig functions, and even piecewise functions.
Is there a free coordinate plotter online that works for CBSE integration problems?
Yes! Platforms like SPYRAL AI Workbench offer a free, no-login coordinate plotter online that supports integration visualization. You can plot any function, set limits, and see the area under the curve form instantly. It’s ideal for Class 11 and 12 students preparing for boards or competitive exams.
How does a trigonometry visualizer help with integration of sin(x) or cos(x)?
A trigonometry visualizer lets you see the wave and the area under it simultaneously. For example, integrating sin(x) from 0 to π gives an area of 2. The visualizer shows why — the positive and negative areas partially cancel, but the net area is clear. This makes identities like ∫ sin²(x) dx much easier to grasp.
Can I use a matrix operations lab to solve integration problems involving systems?
Yes! Many integration problems — especially in differential equations or Laplace transforms — lead to systems of equations. A matrix operations lab lets you input the system, solve it visually, and see how the solution connects to the integral. It’s a powerful bridge between calculus and linear algebra.
Is there a free equation solver CBSE-style tool for integration?
Yes! SPYRAL’s AI Workbench includes a smart equation solver CBSE-style tool that guides you through integration step by step. It explains each rule, shows visual hints, and even corrects mistakes. Unlike generic solvers, it’s designed for CBSE curriculum and supports NCERT-style problems.
How accurate is the area shown in a coordinate plotter online?
The accuracy depends on the tool’s resolution and your settings. Most modern visualizers use numerical integration (like Simpson’s rule) to approximate the area. For most CBSE and JEE problems, the error is negligible. You can increase accuracy by increasing the number of intervals or using exact symbolic computation where available.
Can I use integration FreePik tools for NEET preparation?
Absolutely! Integration is a key part of NEET Physics and Chemistry (especially in thermodynamics and kinetics). Visualizing integrals helps you understand concepts like work done, reaction rates, and energy changes. It’s especially useful for problems involving definite integrals and area under curves.
Do I need to know programming to use these math visualization tools?
No! These tools are designed for students, not coders. You just type the function, set the limits, and interact with sliders. No syntax, no errors — just learning. They’re ideal for CBSE students who want to focus on concepts, not code.
Are these tools aligned with NEP 2020 and CBSE curriculum?
Yes! The tools are designed to support NEP 2020’s competency-based learning and CBSE’s emphasis on conceptual understanding. They cover NCERT integration problems, JEE patterns, and NEET-style applications. The AI explanations are curriculum-aligned, making them perfect for classroom or self-study.
Can teachers use integration FreePik tools in their classrooms?
Yes! Teachers can use these tools to demonstrate integration concepts live on a projector. Students can experiment in real time, ask “what if” questions, and see the math unfold. It’s a powerful way to engage students and move beyond chalk-and-talk. Many schools are adopting these tools as part of their digital labs.
Where can I find more free math visualization tools for CBSE?
You can explore SPYRAL’s free Maths Visualizations toolkit, which includes integration, differentiation, trigonometry, and coordinate geometry tools. All are free, no login required, and optimized for CBSE Class 9–12 students.
Do these tools support integration of inverse trigonometric functions?
Yes! Most advanced visualizers support functions like arcsin(x), arccos(x), and arctan(x). You can plot them, set limits, and see the area under the curve. The AI often provides step-by-step integration using substitution — making complex integrals manageable.
Ready to See Integration Come Alive?
Integration doesn’t have to be a wall of symbols and confusion. With integration FreePik tools — including a coordinate geometry tool, trigonometry visualizer, equation solver CBSE-style, and matrix operations lab — you can see, touch, and master integration like never before.
Whether you're preparing for your Class 12 board exams, JEE, or NEET, these visualizations turn abstract concepts into clear, actionable knowledge. You’ll solve problems faster, understand deeper, and feel more confident in your math journey.
And the best part? You can start right now — for free, no signup, no ads. Just open the tool, type your integral, and watch math move.
Your next “aha!” moment is one click away.