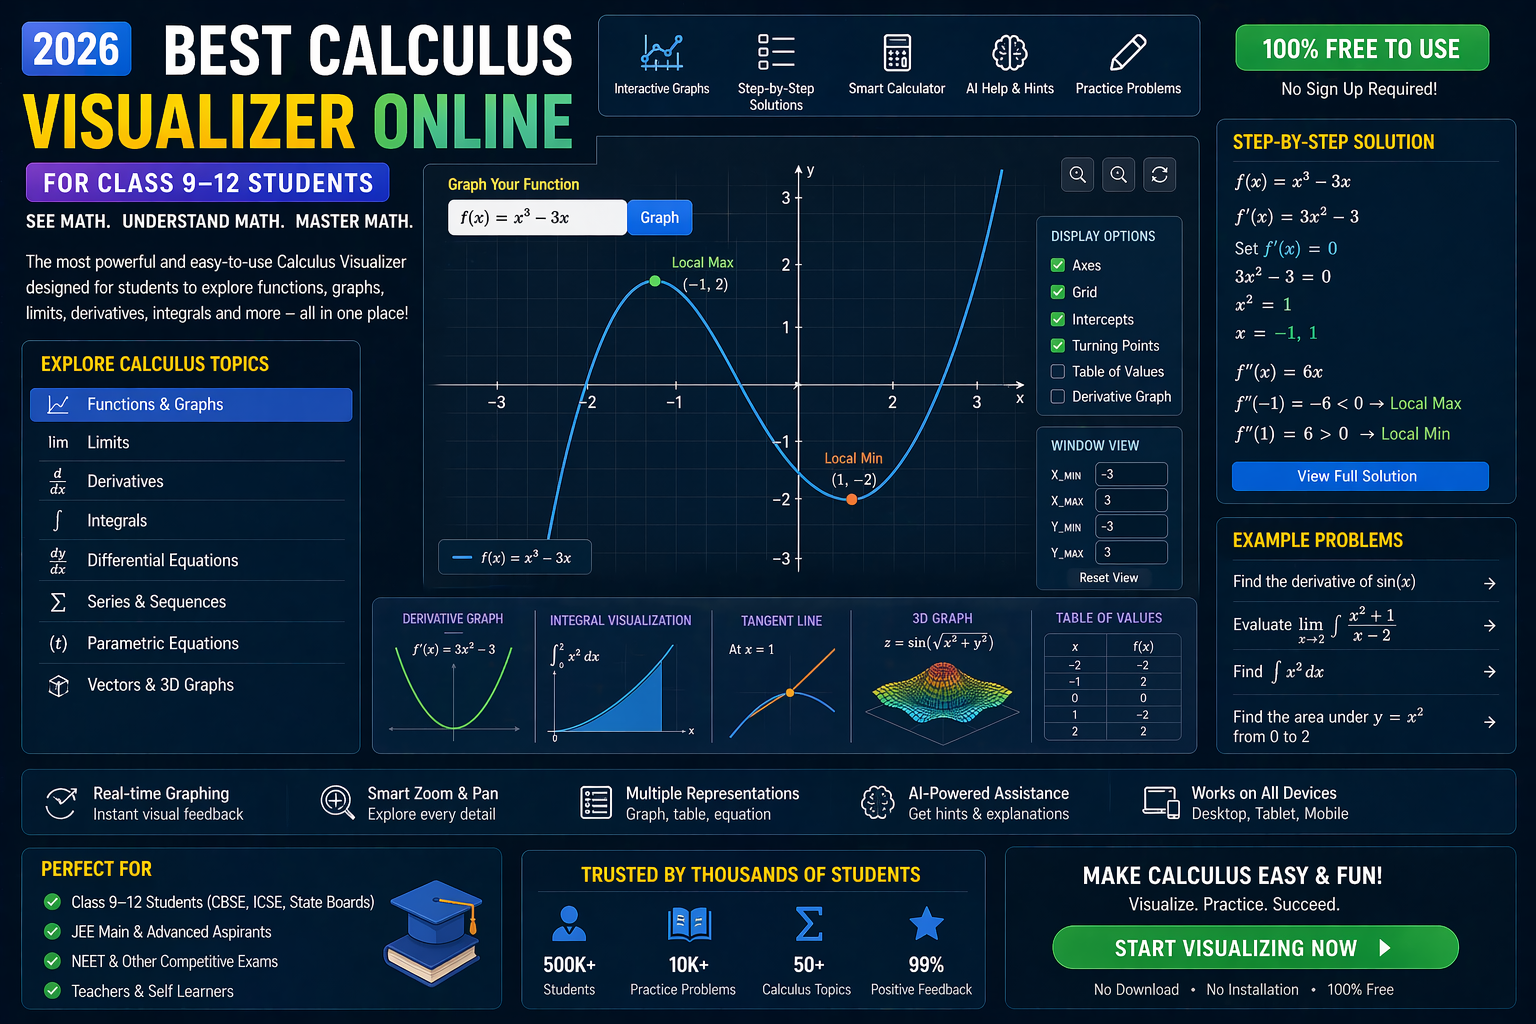
You’re staring at an integration problem on your CBSE Class 12 maths worksheet. The formula looks familiar, but when you try to apply it, the numbers twist into something unrecognizable. What if you could see the integral not as symbols on paper, but as a living, breathing shape on your screen? That’s exactly what an integration free icon does — it turns abstract calculus into an interactive visual experience. No downloads. No logins. Just click, drag, and discover.
At anAIza School by SPYRAL, we’ve built a platform where every integration problem becomes a visual story. Whether you're preparing for JEE, NEET, or your CBSE board exams, seeing math in motion changes everything. Let’s explore how a free integration icon can help you master calculus — and why it’s a game-changer for students and teachers in 2026.
Why This Matters: From Confusion to Clarity in One Click
For decades, Indian students have relied on textbooks and blackboard sketches to understand integration. But calculus isn’t static — it’s dynamic. An integration free icon lets you manipulate limits, change functions, and watch the area under the curve form and shift in real time. This isn’t just helpful — it’s transformative.
Imagine teaching definite integrals in Class 12. Instead of drawing a parabola on the board and hoping students visualize the area, you open a simulation where the curve appears, the integral bounds light up, and the shaded region fills as the value updates. That’s active learning — and it’s what NEP 2020 calls for. The National Education Policy emphasizes experiential learning, and interactive tools like integration icons make that possible without expensive labs or complex software.
Students in CBSE-affiliated schools across India — from Delhi to Bengaluru — are already using these visual tools to crack tough problems. No more memorizing formulas. No more guessing. Just see, understand, and solve.
What Is an Integration Free Icon? (A Visual Revolution in Maths)
An integration free icon is a clickable, interactive symbol that launches a math visualization tool. Unlike static images or PDFs, this icon opens a live simulation where you can:
- Plot functions like x², sin(x), or eˣ
- Set integration limits with sliders
- See the area under the curve fill dynamically
- Get real-time area values and step-by-step breakdowns
- Export or share the visualization for homework or teaching
It’s not just an icon — it’s a maths microscope. You zoom into the behavior of functions, observe how small changes affect the integral, and build intuition that textbooks can’t provide.
How It Works: Behind the Scenes of a Smart Icon
When you click an integration free icon on our platform, the system:
- Parses your input — whether it’s a function like ∫(3x² + 2x) dx or a definite integral from 1 to 3.
- Renders the graph using WebGL for smooth 3D-like rendering.
- Computes the integral symbolically and numerically.
- Animates the area as the integral accumulates.
- Explains each step with AI-powered notes in simple language.
All of this happens in your browser — no installation, no sign-up. That’s what makes it free and instant.
Why “Free” Matters in 2026
In a world where EdTech tools often come with hidden costs, a truly free integration icon democratizes access. Students in rural schools, government-run institutions, and low-income families can now experience high-quality maths visualizations — aligning with India’s push for inclusive education under NEP 2020. No ads. No paywalls. Just learning.
Trigonometry Visualizer: See Sine, Cosine, and Integrals in Motion
Integration and trigonometry go hand in hand in CBSE Class 12. But visualizing ∫sin(x) dx or ∫cos²(x) dx can feel like solving a puzzle in the dark. That’s where a trigonometry visualizer becomes essential.
With a trigonometry visualizer built into the same icon, you can:
- Plot y = sin(x), y = cos(x), or y = tan(x)
- Set integration bounds over one or multiple periods
- Watch the area under the curve form and calculate automatically
- Compare definite integrals like ∫₀^π sin(x) dx = 2
For example, try integrating sin(x) from 0 to π. The visualizer shades the area under the sine wave, and the AI explains why the result is exactly 2 — not 1.99 or 2.01. You don’t just get the answer — you get the meaning.
This kind of clarity is especially helpful for JEE aspirants tackling tricky integrals involving trigonometric identities. Instead of flipping through formula sheets, you see the identity in action — like how sin²(x) + cos²(x) = 1 helps simplify ∫sin²(x) dx.
Coordinate Geometry Tool: Plot Curves and Integrate with Ease
CBSE Class 11 and 12 maths often involves integrating functions like y = √(1 – x²) or y = 1/x. Drawing these by hand is time-consuming and error-prone. A coordinate geometry tool integrated into the icon lets you:
- Enter any function in the form y = f(x)
- Adjust the viewing window (x and y ranges)
- Set upper and lower limits for integration
- See the curve and shaded area simultaneously
- Get the integral value with AI explanation
For instance, try plotting y = √(4 – x²) from –2 to 2. The tool draws a semicircle, and the integral ∫√(4 – x²) dx from –2 to 2 gives the area of a semicircle — πr²/2 = 2π. The visual confirms the result instantly.
Why This Is a Game-Changer for NEET and JEE
In competitive exams, speed and accuracy matter. A coordinate geometry tool with built-in integration helps you:
- Verify your manual calculations quickly
- Understand the geometric meaning of integrals
- Practice with real-time feedback
- Build confidence before exams
No more second-guessing. Just plot, integrate, and learn.
Coordinate Plotter Online: From Points to Integrals in Seconds
What if your problem starts with points, not a function? For example, finding the area under a piecewise curve defined by points (1,2), (2,3), (3,1). A coordinate plotter online lets you:
- Enter x and y coordinates
- Plot the points and connect them
- Use trapezoidal or Simpson’s rule to approximate the integral
- See the area shaded and the result calculated
This is especially useful for CBSE Class 12 students working on applications of integration in real-world contexts. You’re not just solving math — you’re modeling it.
Link to NCERT and CBSE Curriculum
All simulations are mapped to the CBSE Class 11–12 syllabus, including:
- Applications of Integrals (Chapter 8, Class 12)
- Integrals (Chapter 7, Class 12)
- Definite Integrals and Area Under Curves
Teachers can use the coordinate plotter to demonstrate how to find areas bounded by curves — a common exam topic. Students can practice with NCERT examples and get instant feedback.
Matrix Operations Lab: When Integration Meets Linear Algebra
While integration is a calculus concept, it often appears in physics and engineering problems involving matrices — like in quantum mechanics or control systems. A matrix operations lab embedded in the platform lets you:
- Input matrices (e.g., 2x2 or 3x3)
- Perform operations: addition, multiplication, transpose
- Visualize matrix transformations
- Connect to integration via eigenvalues or differential equations
For advanced students, this opens doors to seeing how integration and linear algebra intersect — a key concept in higher mathematics and competitive exams.
Example: Eigenvalues and Differential Equations
Suppose you have a system of differential equations. The matrix of coefficients determines the behavior of solutions. By visualizing the matrix and its eigenvalues, you can predict whether the system is stable — and that stability is often analyzed using integrals. This is how real-world math works — and now you can see it.
Equation Solver CBSE: Solve and Visualize in One Place
Many students jump straight to an equation solver CBSE tool to get answers fast. But what if that tool also showed you the graph and explained the steps? Our platform does exactly that.
Enter an equation like ∫(x³ – 4x) dx or ∫₁⁴ (2x + 1) dx, and the solver:
- Solves it symbolically
- Plots the function
- Shades the area under the curve
- Explains each step in simple Hindi or English
- Links to relevant NCERT exercises
This is more than a calculator — it’s a learning companion that helps you understand why the answer is correct, not just what it is.
Why AI Explanations Beat Textbooks
AI-generated explanations adapt to your level. If you’re a Class 11 student, it uses basic language. If you’re preparing for JEE Advanced, it dives into derivations and alternative methods. This personalized approach is what modern EdTech should deliver — and it’s available for free.
What If You Changed This? 3 Real Experiments to Try Now
Don’t just watch — experiment. Here are three “what-if” scenarios to try with your integration free icon:
1. What if the function was negative?
Try ∫₀^π (–sin(x)) dx. The curve dips below the x-axis. What happens to the integral value? Does the area become negative? The visualizer shows the shaded region flip — and the AI explains why integrals can be negative when the function is below the axis.
2. What if the limits were swapped?
Compute ∫₁⁰ x² dx. The result is –1/3. Now swap the limits: ∫₀¹ x² dx = 1/3. The visualizer flips the shaded area and changes the sign. This is the foundation of the Fundamental Theorem of Calculus — and you just saw it happen.
3. What if the function had a discontinuity?
Try ∫₀² 1/(x–1) dx. The function has a vertical asymptote at x=1. The visualizer shows the curve shooting to infinity. The AI warns you about improper integrals and guides you on how to evaluate them using limits. You’re not just solving — you’re thinking critically.
These experiments build deep understanding. They prepare you for JEE Advanced’s tricky questions and CBSE’s application-based problems.
Try It Free on SPYRAL
Everything discussed in this article is available for free on SPYRAL AI Workbench — Maths Visualizations. No signup required for guest access — just open it and start learning.
Explore SPYRAL AI Workbench — Maths Visualizations →Frequently Asked Questions
What is an integration free icon and how do I use it?
An integration free icon is a clickable symbol that opens an interactive math visualization tool. You enter a function (like x² or sin(x)), set integration limits, and watch the area under the curve form in real time. No downloads or logins are needed — just click and explore. It’s designed to help CBSE Class 9–12 students and teachers visualize calculus instantly.
Can I use a trigonometry visualizer to solve CBSE Class 12 integration problems?
Absolutely. A trigonometry visualizer lets you plot functions like sin(x), cos(x), or tan(x), set integration bounds, and see the area under the curve. It’s especially helpful for problems involving ∫sin(x) dx, ∫cos²(x) dx, or ∫tan(x) dx. The AI explains each step, making it perfect for JEE and NEET prep.
Is there a coordinate geometry tool that helps with integration in CBSE maths?
Yes! Our coordinate geometry tool lets you enter any function y = f(x), plot it, and compute definite integrals between any two x-values. It’s ideal for visualizing areas bounded by curves — a key topic in CBSE Class 12 Chapter 8 (Applications of Integrals). You can adjust the graph’s scale and see the integral value update instantly.
How accurate is the coordinate plotter online for piecewise functions?
The coordinate plotter uses numerical integration (trapezoidal rule) to approximate the area under piecewise-defined curves. It’s highly accurate for most CBSE-level problems and gives results close to analytical solutions. For exact answers, use the symbolic solver, but for real-world data or hand-drawn curves, the plotter is a powerful tool.
Can I use a matrix operations lab to understand integration better?
While matrices and integration are different topics, they intersect in advanced math and physics. A matrix operations lab helps you visualize linear transformations, eigenvalues, and systems of equations — all of which are analyzed using integrals in higher studies. It’s a great way to see how math connects across topics.
Is there a free equation solver CBSE that also shows graphs?
Yes! Our AI-powered equation solver not only solves integration problems but also plots the function and shades the area under the curve. It provides step-by-step explanations and links to NCERT exercises. It’s designed specifically for CBSE students preparing for boards, JEE, and NEET.
Do I need to sign up to use the integration free icon?
No signup is required for guest access. You can open the integration icon, start a simulation, and explore math visualizations immediately. Sign-up is optional and only needed if you want to save your work or track progress. This aligns with our mission to make high-quality math tools accessible to every student in India.
How does an integration free icon support NEP 2020 learning goals?
NEP 2020 emphasizes experiential, competency-based learning. An integration free icon turns abstract calculus into interactive visuals, helping students develop conceptual understanding rather than rote memorization. It supports self-paced learning, critical thinking, and real-world application — all key pillars of the new education policy.
Can teachers use the coordinate geometry tool for classroom demonstrations?
Yes! Teachers can project the coordinate geometry tool on a smartboard and demonstrate how to find areas under curves, compare definite integrals, or explain the Fundamental Theorem of Calculus. The tool is curriculum-mapped to CBSE Class 11–12, making it a perfect fit for Indian classrooms.
What kind of functions can I integrate using the free icon?
You can integrate polynomial, trigonometric, exponential, logarithmic, and rational functions. The platform supports definite and indefinite integrals. For piecewise or custom functions, use the coordinate plotter to approximate the area. The AI handles most standard forms seen in CBSE and competitive exams.
Is the integration visualizer suitable for JEE Advanced preparation?
Absolutely. The integration visualizer helps you understand the geometric meaning of integrals, practice tricky limits, and verify solutions quickly. It’s especially useful for problems involving area between curves, volume of revolution, and applications of definite integrals — all common in JEE Advanced. The AI explanations adapt to advanced levels.
How do I access the integration free icon on my device?
Visit tryspyral.com/workbench on any device with a modern browser (Chrome, Firefox, Edge, Safari). Click the integration icon, enter your function, and start visualizing. It works on laptops, tablets, and even smartphones. No app installation required.
Can I export or save my integration visualizations?
Yes. You can download your visualizations as images (PNG) or share them directly via email or messaging apps. This is helpful for homework submissions, teacher feedback, or study group discussions. The export feature ensures you can keep a record of your learning journey.
From Icons to Insight: Your Path to Mastering Integration
An integration free icon isn’t just a button — it’s a doorway to understanding calculus in a way that textbooks never could. In 2026, with NEP 2020 reshaping Indian education, tools like this are no longer optional. They’re essential.
Whether you’re a Class 12 student preparing for boards, a JEE aspirant tackling tough integrals, or a teacher looking to bring math to life, interactive visualizations change everything. You don’t just solve problems — you experience them.
So next time you see an integration symbol, don’t panic. Click the icon. Drag the sliders. Watch the curve form. And let the math reveal itself — one pixel at a time.
Ready to see calculus in action? Open the SPYRAL AI Workbench now — no signup, no cost, just learning.